Market Review - First Quarter 2016
The first quarter of 2016 began with a 10% correction for major stock market indices, followed by a relatively quick recovery. At its February 11th low, the S&P 500 Index was down 10.4% for the quarter and 14.2% from its all-time high in May 2015. It was the second 10% drop since its high, having experienced a similar correction last August. The graph below portrays the volatility in major stock market indices over the past year.
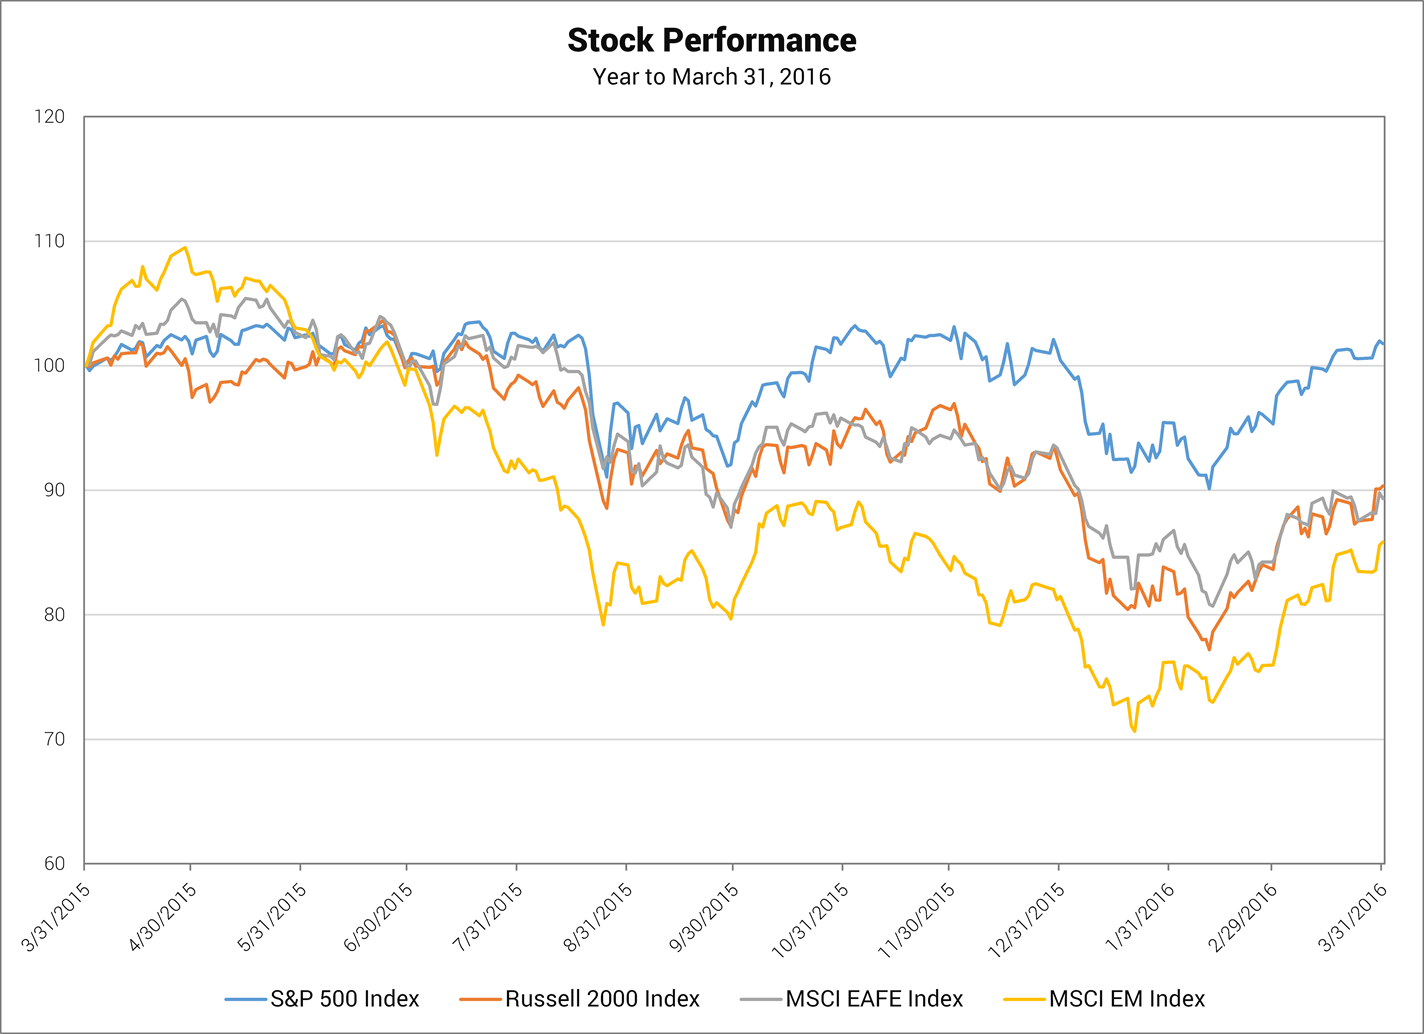
While the S&P 500 was able to recover most of its losses since the peak (and shows positive returns for both the recent quarter and past year) the other major indices suffered significant losses over the past 12 months.
The primary indices for small U.S. companies and developed and emerging foreign markets each declined by at least 9.8% over the past year. These three indices fell into what most analysts refer to as “bear market territory” during the first quarter, having experienced declines greater than 20% from their most-recent highs.
The table below shows the performance of major equity indices for various time periods.
Equity Performance for Periods Ending on March 31, 2016
| Total Return Index | Market Sector | Quarter | 1-year | 3-year | 5-year | 10-year |
|---|---|---|---|---|---|---|
| S&P 500 | Large U.S. Companies | 1.4% | 1.8% | 11.8% | 11.6% | 7.0% |
| Russell 2000 | Small U.S. Companies | -1.5% | -9.8% | 6.8% | 7.2% | 5.3% |
| MSCI EAFE | Developed Int’l Markets | -3.7% | -10.7% | -0.5% | -0.6% | -1.0% |
| MSCI EM | Emerging Int’l Markets | 5.4% | -14.1% | -6.8% | -6.5% | 0.6% |
The sharp drop in stock prices early in the first quarter reflected recessionary fears as a number of global economic indicators showed weakness, especially in the manufacturing sector. For example, one such measure, the manufacturing Purchasing Manager’s Index (PMI), declined in six of the seven largest economies from January to March of this year. However, investors were reassured by the continuing efforts of central bankers to stimulate economic growth, leading to a substantial reversal in the downward trends of stock prices, especially for large U.S. companies. In the U.S., the Federal Reserve moderated its plan to increase rates to normal levels, stating that it now anticipates just two interest rate hikes in 2016, down from its previous guidance of four. In Europe and Japan, central bank policies have produced negative interest rates—a situation which effectively imposes a fee on depositors who wish to hold money at a bank.
Obviously, central bank policies that produce low or negative interest rates are intended to discourage saving, and encourage investment and spending, in order to stimulate economic growth. These policies have also caused money to move from safer assets, such as bonds and CDs, which yield little return, to riskier assets, such as stocks and real estate. While we don’t believe stock prices reflect a bubble, we do feel the U.S. stock market is trading toward the upper end of a fairly valued range. The S&P 500 currently trades at 16.6 times estimated earnings for the next 12 months, which is about 10% above its historical average.
While recessionary concerns have subsided, the expectations for near-term economic growth in the U.S. and abroad are modest at best. As companies struggle to grow their earnings, investors may need to be patient for stock prices to move higher. The accompanying graph shows the strong correlation between earnings and stock prices. As the earnings for companies in the S&P 500 have weakened over the past year, stock prices have failed to advance.
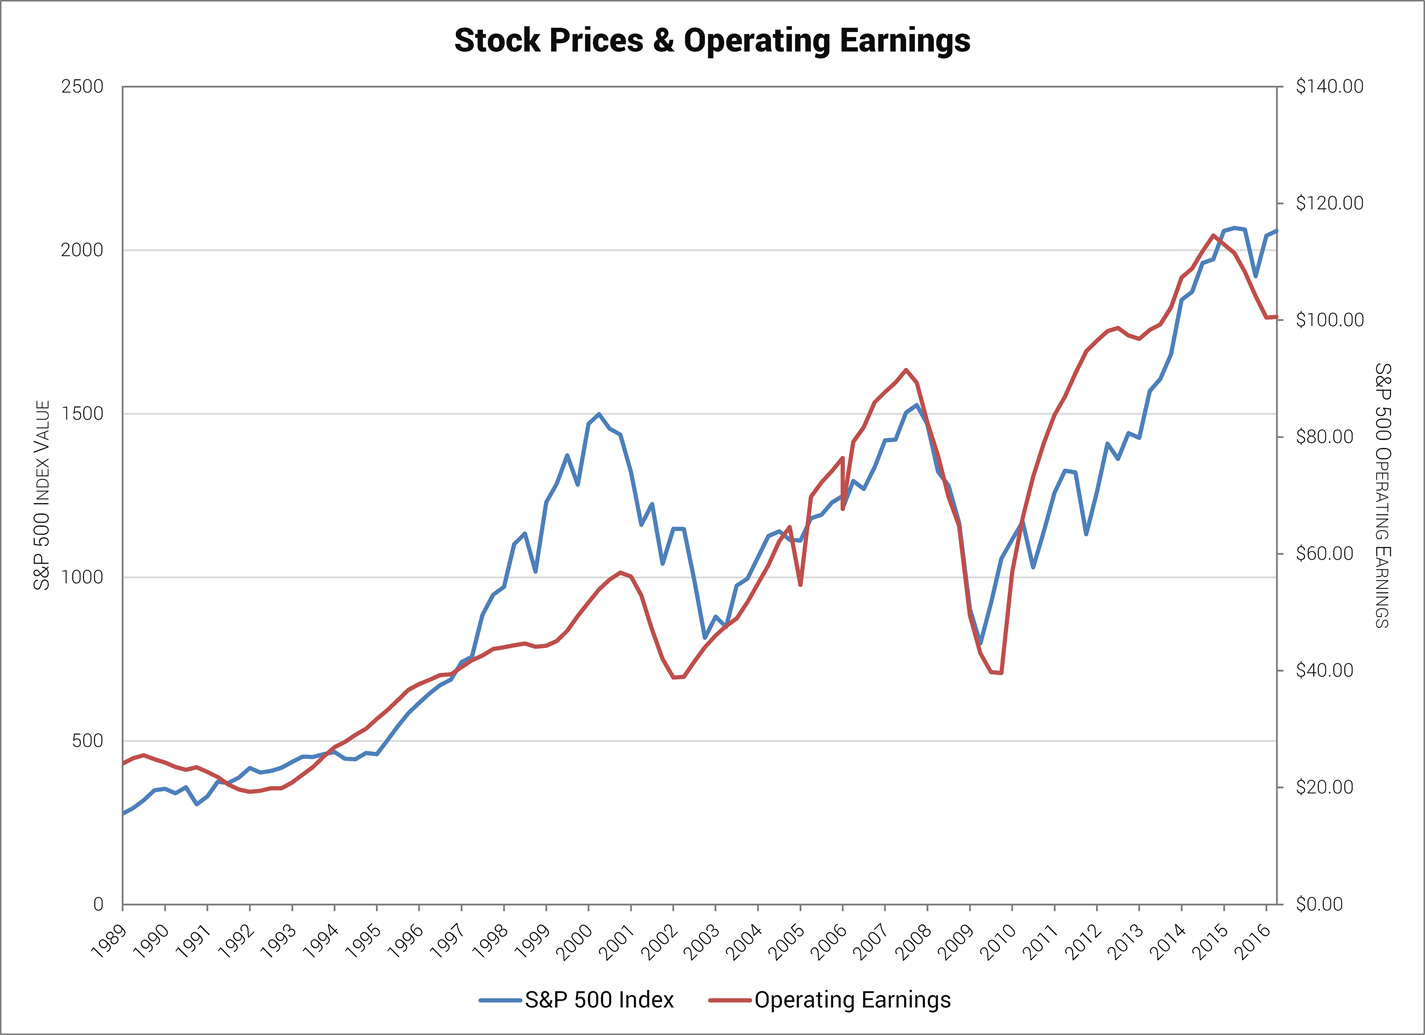
Although the U.S. economy has avoided a recession, U.S. companies are currently experiencing an earnings recession. According to FactSet, earnings for the S&P 500 are estimated to decline by 8.5% for the first quarter of 2016. This will mark the fourth consecutive quarter of earnings decline—the first time this has occurred since the Great Recession. Earnings estimates for U.S. companies for the full year 2016 have dropped sharply over the last three months. Whereas going into this year, analysts were forecasting 8.1% earnings growth for 2016, now they forecast only 2.2%.
As the year progresses, investors will be looking for improved earnings growth. There are reasons to believe this will happen. Over the past year, low energy prices have hurt the earnings of both energy companies and the industrial companies that support the energy sector. While the short-term impact of lower energy prices is a negative to corporate earnings, the long-term impact should be positive, as the U.S. is still a net importer of oil. Lower energy prices for consumers and businesses, which have led to savings, will likely result in increased spending going forward, ultimately producing higher earnings for many businesses.
Earnings for U.S. companies that sell products and services abroad have also been negatively impacted by the strength of the dollar over the past year. This has made U.S. products less competitive, as they become more expensive to foreign buyers, and has reduced earnings from international sales, as foreign currencies are translated into fewer dollars. With the dollar stabilizing against most major currencies, these factors should have less of an impact on earnings comparisons in 2016.
While it is difficult to make accurate predictions concerning the economic cycle, we believe the current economic expansion (which began in July 2009) is likely to continue. This expansion has been characterized by slow growth and significant government intervention. The effect of increased regulation of the financial sector has likely restricted growth, while the stimulative policies of central banks have helped to avoid a recession. We believe that there is pent-up demand for both autos and housing, as these sectors were slow to recover from the last recession. If employment trends and wage growth remain strong, and interest rates and energy prices stay relatively low, we believe consumers will provide the catalyst for stronger economic growth.
During the quarter, the yield on the 10-year Treasury bond fell from 2.27% to 1.79%. This decline in yield reflected concern over weakness in the global economy and continuing efforts by central banks to suppress interest rates. The sharp drop in interest rates produced a strong rally for the bond market. The Barclays Aggregate Bond Index, the broadest benchmark of the U.S. bond market, generated returns of 3.0% for the first quarter. However, longer-term fixed income investments still appear to be relatively unattractive, as they are likely to perform poorly as interest rates rise to normal levels.
The stock market’s dependency on a stimulative Federal Reserve policy, combined with higher-than-average stock valuations, leads us have very modest return expectations for stocks in the near term. That said, equities still appear to be the most attractive asset class for investors with a long-term horizon.
John D. Frankola, CFA
The author is the president of Vista Investment Management, LLC, a Registered Investment Advisory firm. Under no circumstances does this article represent a recommendation to buy or sell stocks. This article is intended to provide information and analysis regarding investments and is not a solicitation of any kind. References to historical market data are intended for informational purposes; past performance cannot be considered a guarantee of future performance. Neither the author nor Vista Investment Management, LLC has undertaken any responsibility to update any portion of this article in response to events which may transpire subsequent to its original publication date.