Market Review - Second Quarter 2020
Global stock markets bounced back strongly during the second quarter of 2020. The S&P 500 Index advanced 20.5%, its best quarterly performance since 1998. Government actions to backstop the economy, progress on the development of COVID-19 treatment therapies and a vaccine, and the gradual reopening of the economy helped to bolster investor confidence.
The table below shows the performance of major equity indices for selected time periods.
Equity Performance for Periods Ending on June 30, 2020
| Total Return Index | Market Sector | Quarter | YTD | 1-year | 3-year | 5-year | 10-year |
|---|---|---|---|---|---|---|---|
| S&P 500 | Large U.S. Companies | 20.5% | -3.1% | 7.5% | 10.7% | 10.7% | 14.0% |
| Russell 2000 | Small U.S. Companies | 25.4% | -13.0% | -6.6% | 2.0% | 4.3% | 10.5% |
| MSCI EAFE | Developed Int’l Markets | 14.9% | -11.4% | -5.1% | 0.8% | 2.1% | 5.7% |
| MSCI EM | Emerging Int’l Markets | 18.1% | -9.8% | -3.4% | 1.9% | 2.9% | 3.3% |
In March, with COVID-19 cases and hospitalizations rising at an alarming rate, most states imposed stay-at-home orders which led to the closing of many businesses and caused an abrupt and deliberate drop in economic activity. In order to support businesses and individuals affected by the shutdown, the Federal Reserve lowered interest rates, Congress passed the CARES Act (providing stimulus payments to individuals and loans to businesses), and the Treasury Department delayed the tax filing deadline by three months. These actions provided some relief to Americans and helped to prevent a complete collapse of the economy.
Stay-at-home orders and social distancing guidelines led to declines in new cases and hospitalizations. Daily new cases declined from almost 40,000 in late April to less than 20,000 in early June. By the end of June, all states had begun reopening in some way. As states relaxed restrictions, the number of new COVID-19 cases escalated to record levels. New cases in the U.S. exceeded 40,000 for each of the last six days of June. Many states have now either paused or rolled back their reopening plans based on the number of new cases.
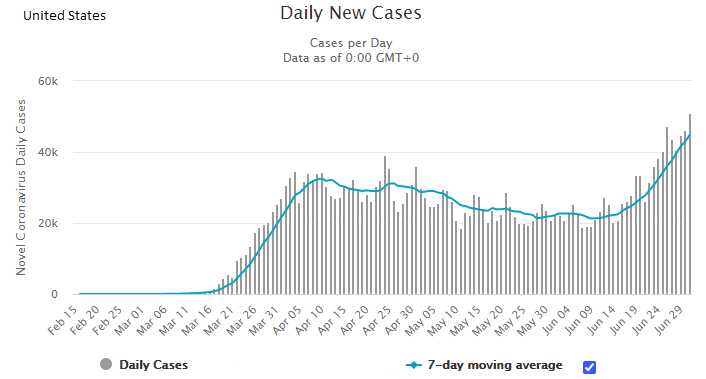
Source: Worldometer
Despite the increase in new COVID-19 cases going into the end of the quarter, stocks held up reasonably well delivering a positive return for the month of June. This trend has led some observers to ask if the market is disconnected from the reality of the pandemic. We think the critical variables affecting stock market performance are the number of COVID-19 deaths, the number of hospitalizations, and the progress of treatment and vaccine development.
The previous graph showed the number of new cases per day, which has been increasing since mid-June. The following graph displays the continuing decline in the number of deaths from its peak in April. The lower number of deaths is likely due to (1) new cases presenting primarily in younger individuals, who are less likely to take precautions but also less likely to become seriously ill, (2) better efforts to protect individuals in high risk groups, such as the elderly, and (3) more effective treatments for those who become ill.
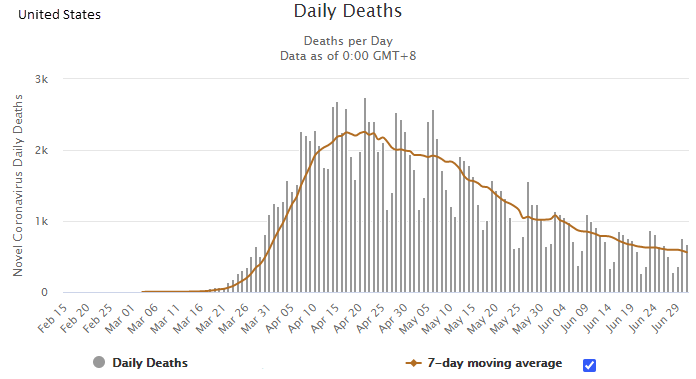
Source: Worldometer
While hospitalizations have increased in several hot spots such as Florida, Texas, and Arizona, most areas appear to have adequate ICU capacity should the number of serious cases increase. Nationally, ICU utilization related to COVID-19 has shown a declining trend over the past two months.
Numerous treatments for patients with COVID-19 are under development. The most promising seems to be Remdesivir, an antiviral that is in Phase III clinical trials (the final series for FDA approval). Other treatments currently being used include Dexamethasone, a common corticosteroid medication to reduce the body’s inflammatory response, and convalescent plasma, a 100-year old technique used to transfer antibodies from recovered individuals in order to protect and treat others.
During the quarter there has been progress on the development of a vaccine. According to the New York Times, there are 13 vaccines in Phase I trials, 9 in Phase II trials, and 3 in Phase III trials. There are more than 130 other vaccines in preclinical development. However, most experts expect that a vaccine will not be available until later this year or early 2021.
Even with new cases spiking, investors seemed to be focused on lower death rates, improved treatment options, and the likelihood of a vaccine in the near term. While it is likely that some additional restrictions could be imposed if the data gets worse, we do not believe the economy will be shut down again.
In June, the National Bureau of Economic Research determined that a recession began in February 2020. This marked the end of the longest economic expansion in U.S. history, which lasted 10 years and 8 months. Considering the U.S. economy is currently in a significant recession, it is remarkable that the S&P 500 Index is just 3.1% lower than it was at the start of the year, and just 8.4% below its all-time high.
The relatively strong year-to-date performance of the S&P 500 Index is in large part due to its construction. The S&P 500 Index is a market-weighted index, which means that its performance is weighted in proportion to the market value of each index member. The largest five companies in the S&P 500–Microsoft, Apple, Amazon, Alphabet (Google), and Facebook–now represent 21.6% of the market value of the entire index. These five companies are all thought to be beneficiaries of the stay-at-home/remote-work economy. Each have great businesses with advantages that are considered by some to be monopolistic. These companies were up an average of 24.1% in the first half of the year. While we have exposure to these five companies in our managed accounts (either directly or through funds), we have concerns that they are becoming overvalued as investors bid up the prices of companies that are plays on the stay-at-home economy. According to Bespoke Investment Group, these five companies have an average price/earnings (P/E) ratio of 36.1 compared to the median P/E of 19.0 for the rest of the S&P 500. While their valuations have not yet reached the extremes of large tech companies during the Dot Com Era, we believe this sector has become riskier over the past several months.
At the opposite end of the performance spectrum are companies whose businesses have been severely disrupted by the pandemic. The S&P Energy, Financial, and Industrial sectors experienced losses of 34.6%, 23.7%, and 14.6%, respectively in the first half of the year. While some of the companies in these sectors will incur permanent damage due to the pandemic and its aftermath, others are likely to make a full recovery. The challenge is to identify those companies that have declined in price but have a strong potential to rebound as the economy improves.
For the stock market to continue its upward trend, the risk of illness and death related to COVID-19 will need to be minimized, and the economy will need to continue on a firm path of recovery. As previously noted, treatments and vaccines will be important factors in solving this issue. But until they become available, compliance with social distancing guidelines will be a significant element in determining the speed of the economic recovery. The late June spike in new cases has mainly been attributed to lack of social distancing in bars, in restaurants, at beaches, at protests, and at Memorial Day celebrations. Interestingly, Goldman Sachs recently analyzed mask usage data from 21 countries and estimated that a mask mandate in the U.S. could substitute for lockdowns that would otherwise subtract nearly 5% from GDP.
While COVID-19 is obviously the greatest risk to equity markets, there is also considerable uncertainty related to unresolved global trade issues and the November elections. The stock market would probably accept a win by either Presidential candidate, but a sweep of both the House and Senate by Democrats could bring fears of a tax cut rollback, which would be negative for stocks.
As part of its plan to support the economy, the Federal Reserve cut its benchmark short-term interest rate in March to a target range of 0.00% to 0.25%. It is expected that it will remain at this level for the foreseeable future. To keep longer-term interest rates low, the Fed is continuing to purchase government bonds. According to Deutsche Bank Research, at the end of the second quarter the Federal Reserve owned approximately 22% of the U.S. government’s outstanding debt. The yield on the 10-year Treasury bond stood at 0.65% at the end of June, compared to 0.70% at end of the first quarter, and 1.91% at end of 2019.
Historically, Treasury bonds offered significantly lower risk with modestly attractive returns compared to equities. The average annual total returns for the 10-Year Treasury bond since 1927 has been 4.9%, compared to 9.9% for the S&P 500. Corporate and municipal bonds currently offer some premium over Treasury securities, but also have historically low yields. Our return expectations for fixed income investments over the next several years are very modest, since we now believe interest rates are likely to stay in a very low range. However, we will continue to employ fixed income securities in portfolios as a hedge to offset equity risk.
Not surprisingly, the U.S. has addressed the COVID-19 pandemic with fewer restrictions on its citizens than most other large countries. China, Korea, Japan and much of Western Europe have reduced the number of daily new cases and deaths to significantly lower levels than the U.S. It is debatable whether this is a result of ineffective leadership or an American culture that accepts greater risk and is sensitive to restrictions on personal freedom. While there remains great uncertainty as to how the pandemic will ultimately play out and how quickly the global economy recovers, we remain optimistic that we will see continuous progress over the next year. In addition, we hope that the lessons learned will reduce the risk of another pandemic in the future.
John D. Frankola, CFA Lawrence E. Eakin, Jr. Matthew J. Viverette
Vista Investment Management, LLC is a Registered Investment Advisory firm. Under no circumstances does this article represent a recommendation to buy or sell stocks. This article is intended to provide information and analysis regarding investments and is not a solicitation of any kind. References to historical market data are intended for informational purposes; past performance cannot be considered a guarantee of future performance. Neither the author nor Vista Investment Management, LLC has undertaken any responsibility to update any portion of this article in response to events which may transpire subsequent to its original publication date.