Market Review - Fourth Quarter 2020
The year 2020 was characterized by unforeseen events and unpredictable financial market performance. COVID-19 caught the world by surprise, infecting over 80 million people across the globe and killing 1.8 million. By year end, the U.S. recorded 20 million confirmed cases and over 345,000 deaths. The amount of human suffering has been monumental, as many have died, suffered from illness, or lost their livelihoods and savings. Most countries imposed economic shutdowns early in the year, causing self-inflicted recessions across the globe. Difficulty limiting the spread of the virus has made economic recovery challenging for many industries and parts of the world. Of the G-20 countries, all except China experienced a decline in GDP for 2020. U.S. unemployment rates have steadily improved since April, but 6.7% of the U.S. labor force remains unemployed heading into 2021. Yet, in what might seem like a cruel irony, most major equity indices generated positive returns in 2020.
The table below shows the performance of major equity indices for selected time periods.
Equity Performance for Periods Ending on December 31, 2020
| Total Return Index | Market Sector | Quarter | 1-year | 3-year | 5-year | 10-year |
|---|---|---|---|---|---|---|
| S&P 500 | Large U.S. Companies | 12.2% | 18.4% | 14.2% | 15.2% | 13.9% |
| Russell 2000 | Small U.S. Companies | 31.4% | 20.0% | 10.2% | 13.3% | 11.2% |
| MSCI EAFE | Developed Int’l Markets | 16.1% | 7.8% | 4.3% | 7.5% | 5.5% |
| MSCI EM | Emerging Int’l Markets | 19.7% | 18.3% | 6.2% | 12.8% | 3.6% |
According to information compiled by Bloomberg, at this time last year—well before the World Health Organization announced a health emergency, and more than two months prior to declaring a global pandemic—Wall Street strategists were forecasting just 1.9% return for the S&P 500 for 2020. It was the lowest forecasted return for any year since 2000. If Wall Street strategists had a crystal ball that foretold that there would be a worldwide pandemic resulting in a global recession, one could only guess that their forecasts would have been even more conservative. It truly demonstrates that markets are unpredictable. And it leaves open the question: how could such a terrible year—one with the most adverse circumstances imaginable—produce positive results for equity investors?
We believe there are several explanations. First, markets are “forward-looking”, and many investors expect a significant improvement from the current environment. While new COVID-19 cases, hospitalizations, and deaths are currently at record levels, investors believe that vaccines will bring an end to the pandemic and permit the return to normal activities sometime in 2021. Second, the Federal Reserve and other central banks around the world swiftly responded, aggressively lowering interest rates and reducing the cost of borrowing for businesses and consumers. The Fed’s intention was to encourage spending as a means to keep people employed. However, these actions made stocks more attractive compared to fixed income investments, which now offer almost no return. Most governments have provided fiscal support as well. The U.S. recently signed into law its second major stimulus program. Finally, the stock market includes many large companies that have benefited from a rapid shift to a more digital economy. Meanwhile, small, private companies, such as restaurants, gyms, beauty salons, and retail stores, have been forced to curtail or close operations.
Both panic selling (fear) and excessive speculation (greed) were apparent in the stock market. According to the Wall Street Journal, citing Fidelity Investments as its source, 18% of its investors sold all of their stock holdings between February 20 and May 15. For investors over 65 years, 30% completely liquidated their stock portfolios. With markets having fallen by more than one-third during this time frame, many investors, fearing an even greater decline, opted to sell at the worst possible time, locking in their losses.
As the Federal Reserve flooded the financial system with cash, the stock market sharply recovered and signs of excessive speculation appeared. Initial public offerings (IPOs) hit a record of $175 billion in 2020, led by Airbnb, DoorDash, and Snowflake. According to Bloomberg, the average one-day return for IPOs in 2020 was 40%, the highest since the Dot Com Bubble. Special purpose acquisition companies (SPACs)—corporations established without an operating business with the intention to acquire another company as a means of taking it public, notably with less cost and oversight than the traditional IPO process—raised over $60 billion in 2020, more than the previous 10 years combined. There are numerous other examples of speculation, including a record increase in trading by retail investors using apps such as Robinhood, margin debt (borrowing to purchase securities) reaching an all-time record at the end of November, and Bitcoin’s 290% increase in 2020.
Growth stocks dramatically outperformed value stocks. In 2020, the S&P 500 Growth Index generated total returns of 33.5% compared to just 1.4% for the S&P 500 Value Index. The disparity in return reflected a theme that certain sectors such as technology, healthcare, and communication services benefited from the accelerated shift to a digital economy, while other sectors such as financial, industrial, real estate, and energy were left behind. As can be seen in following graph, the recent outperformance of growth stocks was the largest since the 1998-2000 run up to the Dot Com Bubble. A similar trend could be observed at that time, as investors anticipated a massive transition to an Internet-based economy and a heavy push to replace antiquated software and hardware to avoid the Y2K date problem. While our investment process incorporates both growth and value stocks, we have become more cautious regarding growth stocks as valuations have risen to historically high levels.
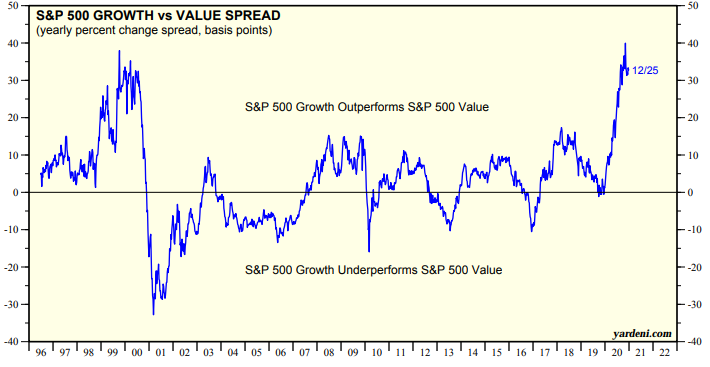
Source: Yardeni Research
Stocks that did not pay dividends trounced those that did. The 116 stocks in the S&P 500 that did not pay a dividend had an average return of 28.1% in 2020, compared to 5.8% return for the 384 stocks that paid a dividend. This trend is related to the growth versus value dynamic. Most companies in the S&P 500 that do not pay dividends are high growth businesses that reinvest their earnings to expand their operations. Historically, investors favor companies that pay dividends and are able to increase them regularly, since it reflects a disciplined capital allocation process, positive corporate earnings and cash flows, and provides a stream of income to the shareholder. In 2020, these companies were underappreciated.
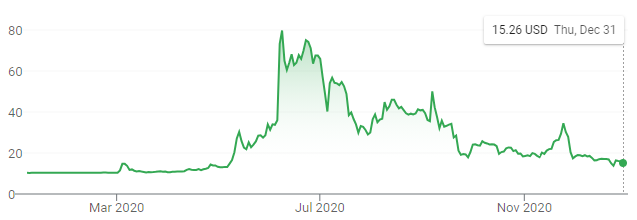
Investors chased stocks with better stories instead of stocks with better earnings. In June, a startup truck company, Nikola, merged with a SPAC as a means to go public. Nikola had no revenue or earnings, and had never built a truck. Over the course of the year, its stock price went from $10.31 to $93.99, and then fell to $15.26 by year end. At its peak price, the company had a market value of $36 billion, which exceeded that of PACCAR, the largest U.S. manufacturer of heavy-duty trucks (including Kenworth and Peterbilt brands). PACCAR is a profitable company with a good long-term track record. Nikola is a company with a business plan to build electric trucks that was named after Nikola Tesla. There are numerous other examples of similar speculative companies in the electric vehicle, online gaming, healthcare, and technology sectors.
The rise and fall of Nikola’s stock in 2020
According to CNBC, there are currently 210 SPACs that have no operating business and whose only asset is cash. These non-operating SPACs were up over 20% on average in 2020 as investors bought the “blank check companies” in hopes of catching the next hot idea.
Considering the contrasts in market performance over the past year, our conclusion is that some stocks are expensive and should be considered speculative, while other stocks (many of which were hurt by the pandemic-induced recession) are reasonably valued and poised for recovery.
We commented earlier that at this time last year Wall Street strategists’ average forecast of equity returns for 2020 was very conservative. For 2021, their consensus estimate is 9.3% total return for the S&P 500. These strategists, whose primary job responsibility is to predict the returns of the stock market, have been wrong by an annual average of 13.1% over the past 21 years. There have been six negative years; none of them were predicted to be losing years. In the six years with losses, the forecast was wrong by an average of 26.0%. We continue to contend, no one can predict the short-term performance of the stock market.
Since 1927, U.S. stocks (as measured by the S&P 500) have produced average annual returns of 9.9%, which has exceeded the rate of inflation by 6.9% annually. Corrections to stock prices occur frequently and are unpredictable. Despite the short-term risks, we continue to regard equities as critical to achieving long-term portfolio growth.
As we enter 2021, we think several factors are crucial in order for equities to continue to generate positive returns for the year. First, vaccines need to be effective at curtailing the virus, and people must be willing and able to get vaccinated. Second, interest rates need to remain low. The 10-year Treasury bond ended the year at 0.92%, down from 1.92% at the end of 2019. Some increase in interest rates can be tolerated by the market, but a large spike could derail the economic recovery and pressure stock valuations. Finally, corporate earnings need to increase significantly. Stock valuations cannot be supported at current levels unless earnings rise meaningfully. The current price/earnings ratio of the S&P 500 is 22.4 times next 12-month estimated earnings, considerably higher than the 15.7 average of the past 10 years.
We appreciate you placing your trust in us over the past year, and we wish you and your family all the best in 2021.
John D. Frankola, CFA Lawrence E. Eakin, Jr. Matthew J. Viverette
Vista Investment Management, LLC is a Registered Investment Advisory firm. Under no circumstances does this article represent a recommendation to buy or sell stocks. This article is intended to provide information and analysis regarding investments and is not a solicitation of any kind. References to historical market data are intended for informational purposes; past performance cannot be considered a guarantee of future performance. Neither the author nor Vista Investment Management, LLC has undertaken any responsibility to update any portion of this article in response to events which may transpire subsequent to its original publication date.