Market Review - Second Quarter 2021
Major stock markets performed strongly in the second quarter of 2021 as economies across the globe continued to recover from the recession caused by the COVID-19 pandemic. The S&P 500 Index generated total returns of 8.6% during the second quarter. Stocks enjoyed support from ongoing accommodative monetary policy, promising economic data, strong corporate earnings, and substantial progress in COVID-19 prevention. Remarkably, the S&P 500 has gained 36.5% since the beginning of 2020, prior to the economic restrictions intended to slow the spread of COVID-19.
The table below shows the performance of major equity indices for selected time periods.
Equity Performance for Periods Ending on June 30, 2021
| Total Return Index | Market Sector | Quarter | 1-year | 3-year | 5-year | 10-year |
|---|---|---|---|---|---|---|
| S&P 500 | Large U.S. Companies | 8.6% | 40.8% | 18.7% | 17.7% | 14.8% |
| Russell 2000 | Small U.S. Companies | 4.3% | 62.0% | 13.5% | 16.5% | 12.3% |
| MSCI EAFE | Developed Int’l Markets | 5.2% | 32.4% | 8.3% | 10.3% | 5.9% |
| MSCI EM | Emerging Int’l Markets | 5.1% | 40.9% | 11.3% | 13.0% | 4.3% |
The Federal Reserve’s response to the COVID-19 pandemic has been the most vigorous monetary intervention in modern history. And while it has stimulated the economy as intended, it has also led to significant asset price appreciation (especially in equities and housing). Since 1977, the Federal Reserve has acted under a dual mandate: to promote maximum employment and price stability. Since March 2020, the Federal Reserve has primarily focused on employment. To accomplish this, Federal Reserve Chairman Jerome Powell used a comprehensive assortment of financial tools: maintaining a near zero federal funds rate (the overnight lending rate for banks), short-term loans to primary dealers at a near zero rate, a one-time purchase of $700 billion of Treasury and mortgage-backed securities coupled with an ongoing commitment of monthly purchases of at least $120 billion, and much more. To put it simply, the Federal Reserve has flooded the economy with cash to keep interest rates at historically low levels, with the goal of keeping the economy functioning and American people employed. Transcripts from Federal Open Market Committee meetings have indicated that interest rate increases are unlikely to occur until 2023.
While a “fast and strong” approach to monetary policy has undeniably supported financial markets for the past sixteen months, fears of runaway inflation have begun to raise concerns. The Consumer Price Index (CPI) measures the cost of a hypothetical “basket of goods.” As of May 2021, the CPI increased by 5.0% versus the same month in the prior year. Though this increase is large, there are three things to keep in mind. First, the price levels in 2020 are a misleading benchmark, given the economic drought that occurred this time last year. Second, the Federal Reserve has maintained the stance that the unusually high inflation rate is transitory, or temporary in nature. When the pandemic hit, many manufacturers were forced to shut down factories and lay off workers. As the economy began to recover faster than many expected, lean supply chains for many products were left caught off guard and unequipped to meet demand. Though pockets of sustained price inflation may exist in certain end markets, it is probable that production will scale, and prices will normalize. Finally, fixed income markets, which are highly sensitive to inflationary concerns, have displayed no signs that inflation will persist beyond the near term. As inflation rises, bond yields tend to increase as to maintain the same rate of inflation-adjusted return. Currently, the 10-year Treasury bond yields just 1.44%, significantly below its historical average of 5.0%. Despite recent data and the inflationary fears of some analysts, we believe the long-term inflation rate will be roughly in line with its 20-year average of 2.1%.
Economic recovery can be measured through various lenses. As of April 2021, personal savings accounted for 14.9% of disposable income. This is the highest savings rate in the U.S. since 1975. These historic levels of saving may seem to imply that Americans are spending less; but that implication would be incorrect. The Personal Consumption Expenditure Index (PCE) is a metric used by the Federal Reserve, which tracks how households are spending their money. During the spring of 2020, economic uncertainty and stay-at-home orders resulted in an overall decline in consumer spending. Most product types saw consumption modestly decline or remain flat, followed by gradual increases starting in July 2020. Energy goods saw the steepest drop in consumption, declining by 25.26% in the second quarter of 2020. Today, overall personal consumption is 1.79% above pre-pandemic levels, with energy goods up 3.73% during the same period. One explanation for higher savings and higher spending is simply increased household income: in March, personal income growth hit a record breaking 21.1%, primarily due to stimulus checks in the COVID relief package (American Rescue Plan Act of 2021). Though the unemployment rate remains moderately elevated (5.8%), there is an obvious over-supply of jobs for those individuals seeking work. New business applications have skyrocketed since June 2020 according to the National Bureau of Economic Research. Even accounting for a sharp decline between March and May of last year, 2020 holds the record for new business applications in a calendar year. Regardless of which data point you track, the economy appears to be firing on all cylinders.
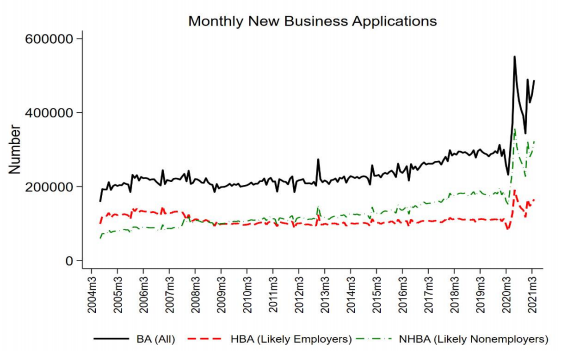
Source: National Bureau of Economic Research (NBER)
Strong stock market performance has also been propelled by surprisingly robust earnings results. At the beginning 2021, the consensus forecast for earnings growth for the first quarter of 2021 was 16% compared to weak prior year numbers. This forecast compiled from Wall Street analysts ended up being wildly off target; S&P 500 companies grew earnings at a rate of 52.4% in the first quarter with 86% of companies outperforming their estimates. The strongest rate of outperformance came from the Financial, Technology, and Energy sectors. Analysts now expect second quarter earnings to grow by 61.5%, and 2021 to be a record setting year for corporate bottom lines.
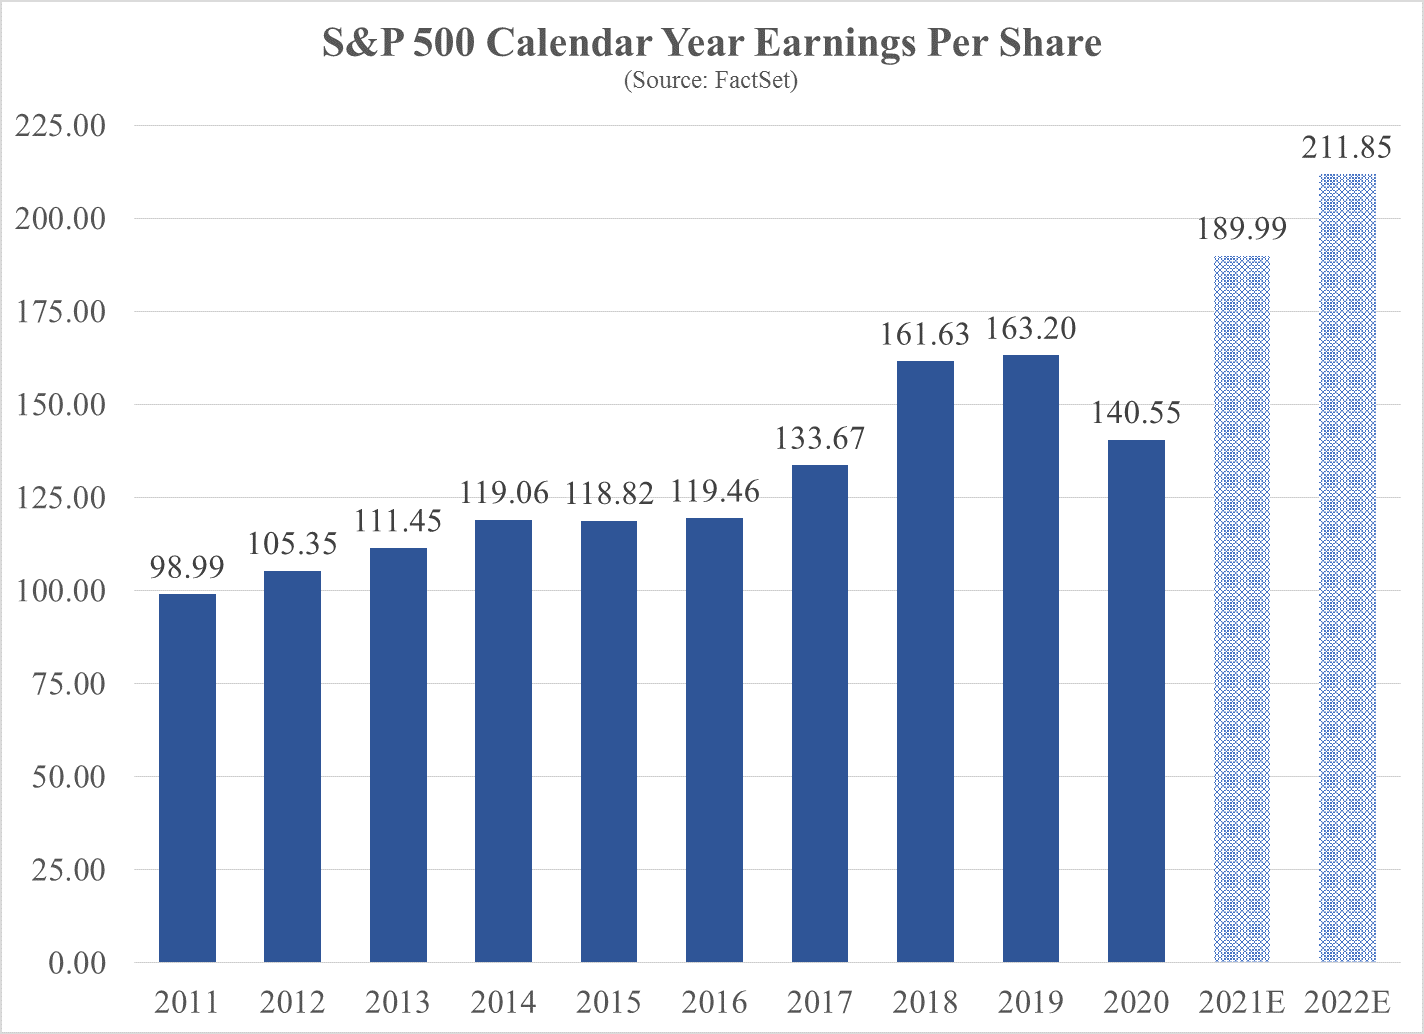
Source: FactSet
As the second quarter progressed and restrictions were lifted by businesses and state governments, there was a resurgence in domestic industries most affected by the pandemic—dining, entertainment, energy, and travel. At the end of March, the seven-day moving average for new daily cases of COVID-19 in the U.S. was slightly below 65,000. Currently, Johns Hopkins University reports a seven-day moving average of 12,474. New daily cases have dropped by about 80% since the end of the first quarter, and 96% since peaking in early January. Currently, about 57% of the U.S. adult population is fully vaccinated, and about 66% have received at least one dose. According to the New York Times, all but two states have fully lifted pandemic-related restrictions. While the impact of COVID-19 on U.S. economic activity is lessening, the pandemic still ripples across the economy through disruptions to the global supply chain—from chip shortages that are affecting the production of automobiles, to the cost of freight, and bottlenecks at ports. Successful mitigation of the spread of COVID-19 remains a key factor for the health of financial markets. Primarily, we identify three potential risks that could destabilize market performance: the slowing vaccination rate, the increasing prevalence of highly contagious variants (specifically variant B1617.2, otherwise known as the Delta strain), and the potential emergence of a variant for which the major vaccines do not offer protection. Globally, the slow pace of vaccination is a major concern, as it increases the likelihood that a vaccine-resistant strain could develop, and it affects the free flow of people and goods. However, we are generally optimistic that cases and deaths will continue to decline and the economy will continue to improve as more of the population becomes vaccinated.
In the second quarter, the Bloomberg Barclays Aggregate Bond Index generated total returns of 1.83% as interest rates on longer-maturity bonds declined. The yield on the benchmark 10-year Treasury bond decreased from 1.74% to 1.44%, as bond market participants dismissed concerns over higher inflation. At its June meeting, the Federal Reserve maintained its benchmark short-term interest rate at a range of 0% to 0.25%, but signaled the possibility of rate increases in 2023, sooner than previously projected. Because longer-term bonds would suffer a significant loss if interest rates increase to more normalized levels, we continue to maintain a relatively short-term average maturity for the fixed income investments in our managed portfolios in order to minimize this risk.
While we are encouraged by restrictions being lifted, the warmer weather, and the ability to see faces again, we have some concern that much of the good news has already been priced into stock valuations. As stimulative activity is phased out over the rest of the year, it would not be surprising if equity returns moderate, reflecting more modest growth expectations. Although recent investor optimism has been positive for equity returns, we would prefer for the market to trade in a fairly valued range, rather than become speculative, and therefore at greater risk of a correction.
John D. Frankola, CFA Lawrence E. Eakin, Jr. Matthew J. Viverette
Vista Investment Management, LLC is a Registered Investment Advisory firm. Under no circumstances does this article represent a recommendation to buy or sell stocks. This article is intended to provide information and analysis regarding investments and is not a solicitation of any kind. References to historical market data are intended for informational purposes; past performance cannot be considered a guarantee of future performance. Neither the author nor Vista Investment Management, LLC has undertaken any responsibility to update any portion of this article in response to events which may transpire subsequent to its original publication date.