Market Review - Second Quarter 2022
Stocks and bonds declined sharply in the second quarter of 2022. The S&P 500 Index suffered a 16.1% loss, as supply chain disruption and labor shortages (caused by the pandemic) combined with increasing energy costs (related to the war in Ukraine) fueled persistent inflation, prompting the Federal Reserve to raise interest rates. Consequently, fears of a recession have been mounting among equity investors. Bonds, which usually provide a buffer when stocks decline, continued to fall in the face of rising interest rates. The Bloomberg Aggregate Bond Index lost 4.7% during the quarter.
The S&P 500 Index generated losses of 20.0% for the first six months of the year, its worst first half-year performance since 1970. Over the same period, the Bloomberg Aggregate Bond Index lost 10.4%, its worst first half since the index was created in 1973.
The table below shows the performance of major equity indices for selected time periods.
Equity Performance for Periods Ending on June 30, 2022
| Total Return Index | Market Sector | Quarter | YTD | 1-year | 3-year | 5-year | 10-year |
|---|---|---|---|---|---|---|---|
| S&P 500 | Large U.S. Companies | -16.1% | -20.0% | -10.6% | 10.6% | 11.3% | 13.0% |
| Russell 2000 | Small U.S. Companies | -17.2% | -23.4% | -25.2% | 4.2% | 5.2% | 9.4% |
| MSCI EAFE | Developed Int’l Markets | -14.5% | -19.6% | -17.8% | 1.1% | 2.2% | 5.4% |
| MSCI EM | Emerging Int’l Markets | -11.5% | -17.6% | -25.3% | 0.6% | 2.2% | 3.1% |
Bear Market: When prices decline by 20% or more from recent highs
On June 13, 2022, the S&P 500 became the last major equity index to fall into bear market territory. Over long-term periods, stock prices are highly correlated with the earnings and cash flows of companies. Bear markets tend to occur when investors anticipate a recession, as a broad decline in economic activity will generally result in decreased corporate earnings.
Recession: A significant decline in economic activity spread across the economy, lasting more than a few months
Considering how strong the economy has been over the past year, a slowdown from current levels would not be surprising. Anyone who has recently tried to purchase a home or a car, travel by plane, or hire an employee understands that demand far outstrips supply in many areas – even though prices are considerably higher than a year ago.
Excess demand over the past year was likely the result of low borrowing costs, pent-up demand as spending was deferred due to the pandemic, and stimulus provided by the government. The constrained supply can be attributed to COVID shutdowns (still affecting some countries, like China), and the associated supply chain disruptions (in the form of production and shipping backlogs), and the large number of employees who permanently left the workforce due to the pandemic.
The last inflation report indicated an 8.6% year-over-year increase in the Consumer Price Index, the highest rate since 1981. While inflation was initially characterized as transitory by the Federal Reserve, the problem has not receded. As a result, the Fed has been forced to move aggressively to increase interest rates in hopes of slowing demand and reducing inflation. In June, the Fed increased its benchmark interest rate by 0.75% to a range of 1.50% to 1.75%. It has indicated that it will likely continue to increase this rate to over 3.0% by year end.
The actions of the Fed are intended to slow the economy and reduce inflation without causing a recession, what is commonly referred to as a “soft landing”. However, the Fed can only influence the demand side of the equation. The war in Ukraine and its impact on global energy and food supplies, and China’s Zero-COVID policy—which could remain in place for the next five years—represent inflation variables largely outside of the control of the Federal Reserve and U.S. government. With an unemployment rate of just 3.6%, there are currently twice as many job openings as there are people seeking employment. Low unemployment is generally desirable, but at a rate this low, it is likely to keep upward pressure on inflation.
There are, however, signs that higher interest rates are beginning to help cool off the economy. Existing home sales have declined by 16.6% over the last four months. That’s not surprising considering the 30-year fixed mortgage rate has risen to 5.8%, the highest level since 2008, and more than double the lowest rate in 2021, which was 2.7%.
Although the stock market may be foreshadowing a recession, most economists are still expecting modest near-term growth for the economy. The Conference Board is currently forecasting 2.3% GDP growth for 2022 and 1.8% for 2023. The Federal Reserve is projecting 1.7% growth for both years.
Corporate earnings estimates for 2022 have seen only minor adjustments, with S&P 500 earnings expected to increase by 8.9% according to Zacks Research. Second quarter earnings reports will provide a better picture as to overall economic conditions and will influence the short-term market direction. Current expectations are for 2.1% earnings growth in the second quarter.
Bear markets have predicted 14 out of the last 8 recessions since World War II.
This quip is a variation of a joke made by economist Paul Samuelson in 1966. The point being that the stock market is frequently wrong when it declines in anticipation of a recession that either does not materialize or is less severe than anticipated. Considering the tendency of the market to overreact, it should not be surprising that when stocks fall by 20% into bear market territory, the next year is likely to produce above-average returns. The average return for the S&P 500 from the day the market crosses the 20% decline threshold to one year later has been 17.7%. While that does not result in a full recovery, it exceeds the long-term stock market average annual return of 10.2%. In 11 of 14 bear markets since 1945, the index was higher one year after the bear market began.
Source: Bespoke Investment Group
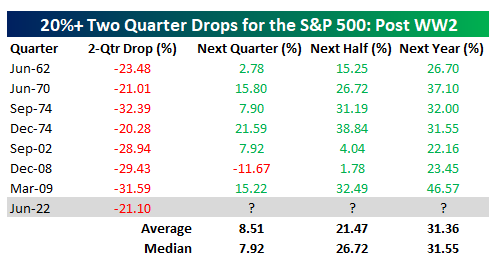
The quicker the decline, the stronger the recovery has been, as shown in the adjacent table. There have been seven bear markets when the market dropped 20% in just two quarters, as has occurred this year. In each of those bear markets the S&P 500 had positive returns after one year with an average return of 31.4%.
In the eight bear markets which accurately predicted a recession, the average return after one year was 13.9%, although there were two times when the market fell another 20%. The most recent was the Great Recession in 2007-2008, which saw the market decline another 29.1% as investors reacted to a global financial meltdown. Our conclusion is that bear markets have generally been good periods for equity investments, except for a period of significant economic stress. Currently, the economy does not appear to be at risk for a major economic crisis.
Equity valuations have improved
The forward price-to-earnings ratio of the S&P 500 has declined from 21.5 at the beginning of the year to 15.8 currently. The five-year average is 18.6, and the ten-year average is 16.9. Small companies, which have declined further than large companies, are trading at just 11.9 times next 12-month earnings.
Morningstar, an independent investment research firm, publishes a ratio that we regard as a very good indicator of overall market valuation. Morningstar asks its analysts to assign a fair value to each company that they follow. It then calculates a ratio of stock price to fair value for all companies in its coverage. Below is a chart showing the history of this indicator since its inception.
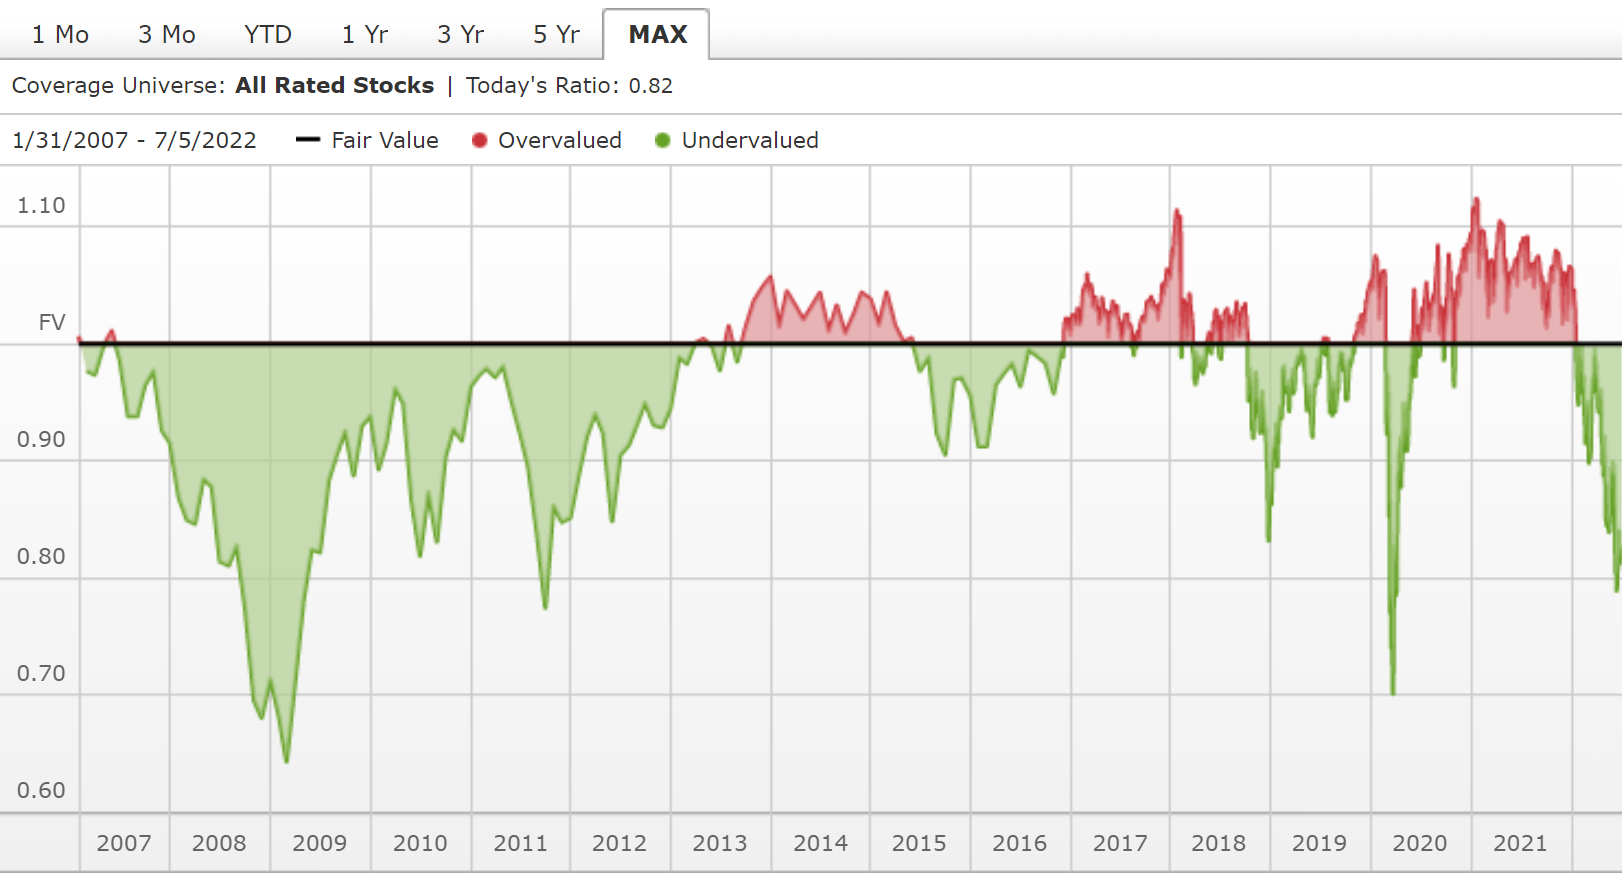
Source: Morningstar
Currently, the ratio of stock price to fair value is 0.82 indicating that Morningstar analysts estimate that the median stock in its universe of coverage is trading 18% below its fair value. The chart illustrates that there have been just a few periods in the last 16 years when stocks looked as attractively valued as they are now. Below we show the S&P 500 annualized returns from the point in time that a similar valuation discount first occurred.
S&P 500 Return following Morningstar Fair Value discount of at least 18%
| Start Date | 06/30/2008 | 06/30/2010 | 09/30/2011 | 12/24/2018 | 03/12/2020 |
|---|---|---|---|---|---|
| Years | 14.0 | 12.0 | 10.8 | 3.5 | 2.3 |
| Total Return | 291% | 363% | 311% | 71% | 58% |
| Annualized Return | 10.2% | 13.6% | 14.1% | 16.5% | 22.1% |
Return to “Normal” is in progress
In many respects, the bear market has coincided with a return to more normal markets. In March of 2021, the 10-Year Treasury Note had a yield of just 0.3%. The yield on June 30, 2022 stood at 3.0%, making it a more attractive investment, and less distorted by the Fed’s stimulative policy. The speculative bubbles in cryptocurrencies, non-fungible tokens (NFTs), special purpose acquisition companies (SPACs), and initial public offerings (IPOs) have deflated. COVID has morphed from pandemic to endemic. As noted previously, stock valuations are more reasonable. For most Americans life has largely returned to pre-pandemic conditions.
What is not normal is the current level of inflation. For most of the past 40 years, inflation has not been a concern for most Americans. However, the current high level appears to be very damaging to consumer confidence. The University of Michigan Consumer Sentiment Survey indicated that more Americans are dissatisfied with the economy currently than at the depth of the recession in 2008 when unemployment was greater than 10% and almost 10 million people lost their homes. Consumers are likely to remain apprehensive about the economy until inflation is curtailed.
While inflation is elevated and currently dominating headlines, we believe it will gradually moderate as supply and demand for goods and services become more balanced. Certain fixed income securities which have provisions for paying interest based on the future inflation rate currently reflect that investors expect inflation to be less than 3.0% two years from now. This level is consistent with the Federal Reserve’s target for inflation.
No one rings the bell at the bottom of the market (prices could decline further)
Lower stock market values and greater market volatility make many investors anxious and often lead to more selling. Rather than focusing on the long-term, their tendency is to try to sell current holdings with the hopes of avoiding further losses and getting back in when there is less uncertainty. Unfortunately, for most investors who attempt to time the market bottom, it is higher prices that lead to a feeling of confidence and less uncertainty. In other words, by the time these investors decide to get back in, the opportunity has passed.
The stock market reflects what investors are willing to pay for investments at a moment in time. A company’s market price can vary significantly based on investor sentiment. However, the market value of a company does not necessarily reflect the true underlying value of a company’s business. A company’s intrinsic value changes slowly over time and is dependent on the value of the products and services it offers, the abilities of its management to execute, and the technology it employs to perform more efficiently than its competitors. Our research effort attempts to determine an investment’s intrinsic value, rather than guessing at the short-term direction of the market.
It is impossible to predict if stock prices will decline further. However, we do believe that the stock market will recover over the long term, regardless of whether a recession materializes. Our process continues to seek out investments with strong fundamentals and to rebalance equity and fixed income exposure within the ranges set by a client’s investment policy. It is this discipline that we believe enables clients to achieve their long-term objectives within their risk tolerance.
John D. Frankola, CFA Lawrence E. Eakin, Jr. Matthew J. Viverette
Vista Investment Management, LLC is a Registered Investment Advisory firm. Under no circumstances does this article represent a recommendation to buy or sell stocks. This article is intended to provide information and analysis regarding investments and is not a solicitation of any kind. References to historical market data are intended for informational purposes; past performance cannot be considered a guarantee of future performance. Neither the author nor Vista Investment Management, LLC has undertaken any responsibility to update any portion of this article in response to events which may transpire subsequent to its original publication date.